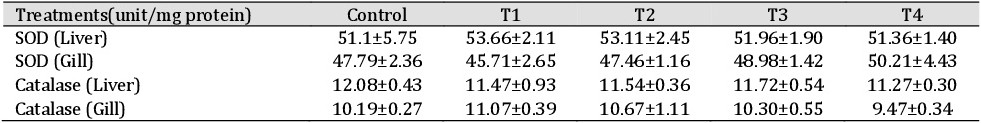
Table 7. Superoxide Dismutase (SOD) and Catalase activity for the different experimental groups. Data expressed as Mean ± SE n=3; Mean values bearing different superscripts in the same rows vary significantly (p˂0.05). SOD Specific activity is expressed in 50% inhibition of epinephrine auto oxidation/mg protein/minute. Specific activity of catalase expressed in nano moles H2O2 decomposed /minute /mg protein